Two real charts from the Friday, September 25, 2026 pattern scan, exactly as members saw them.
Friday, September 25, 2026 · Weekly chart
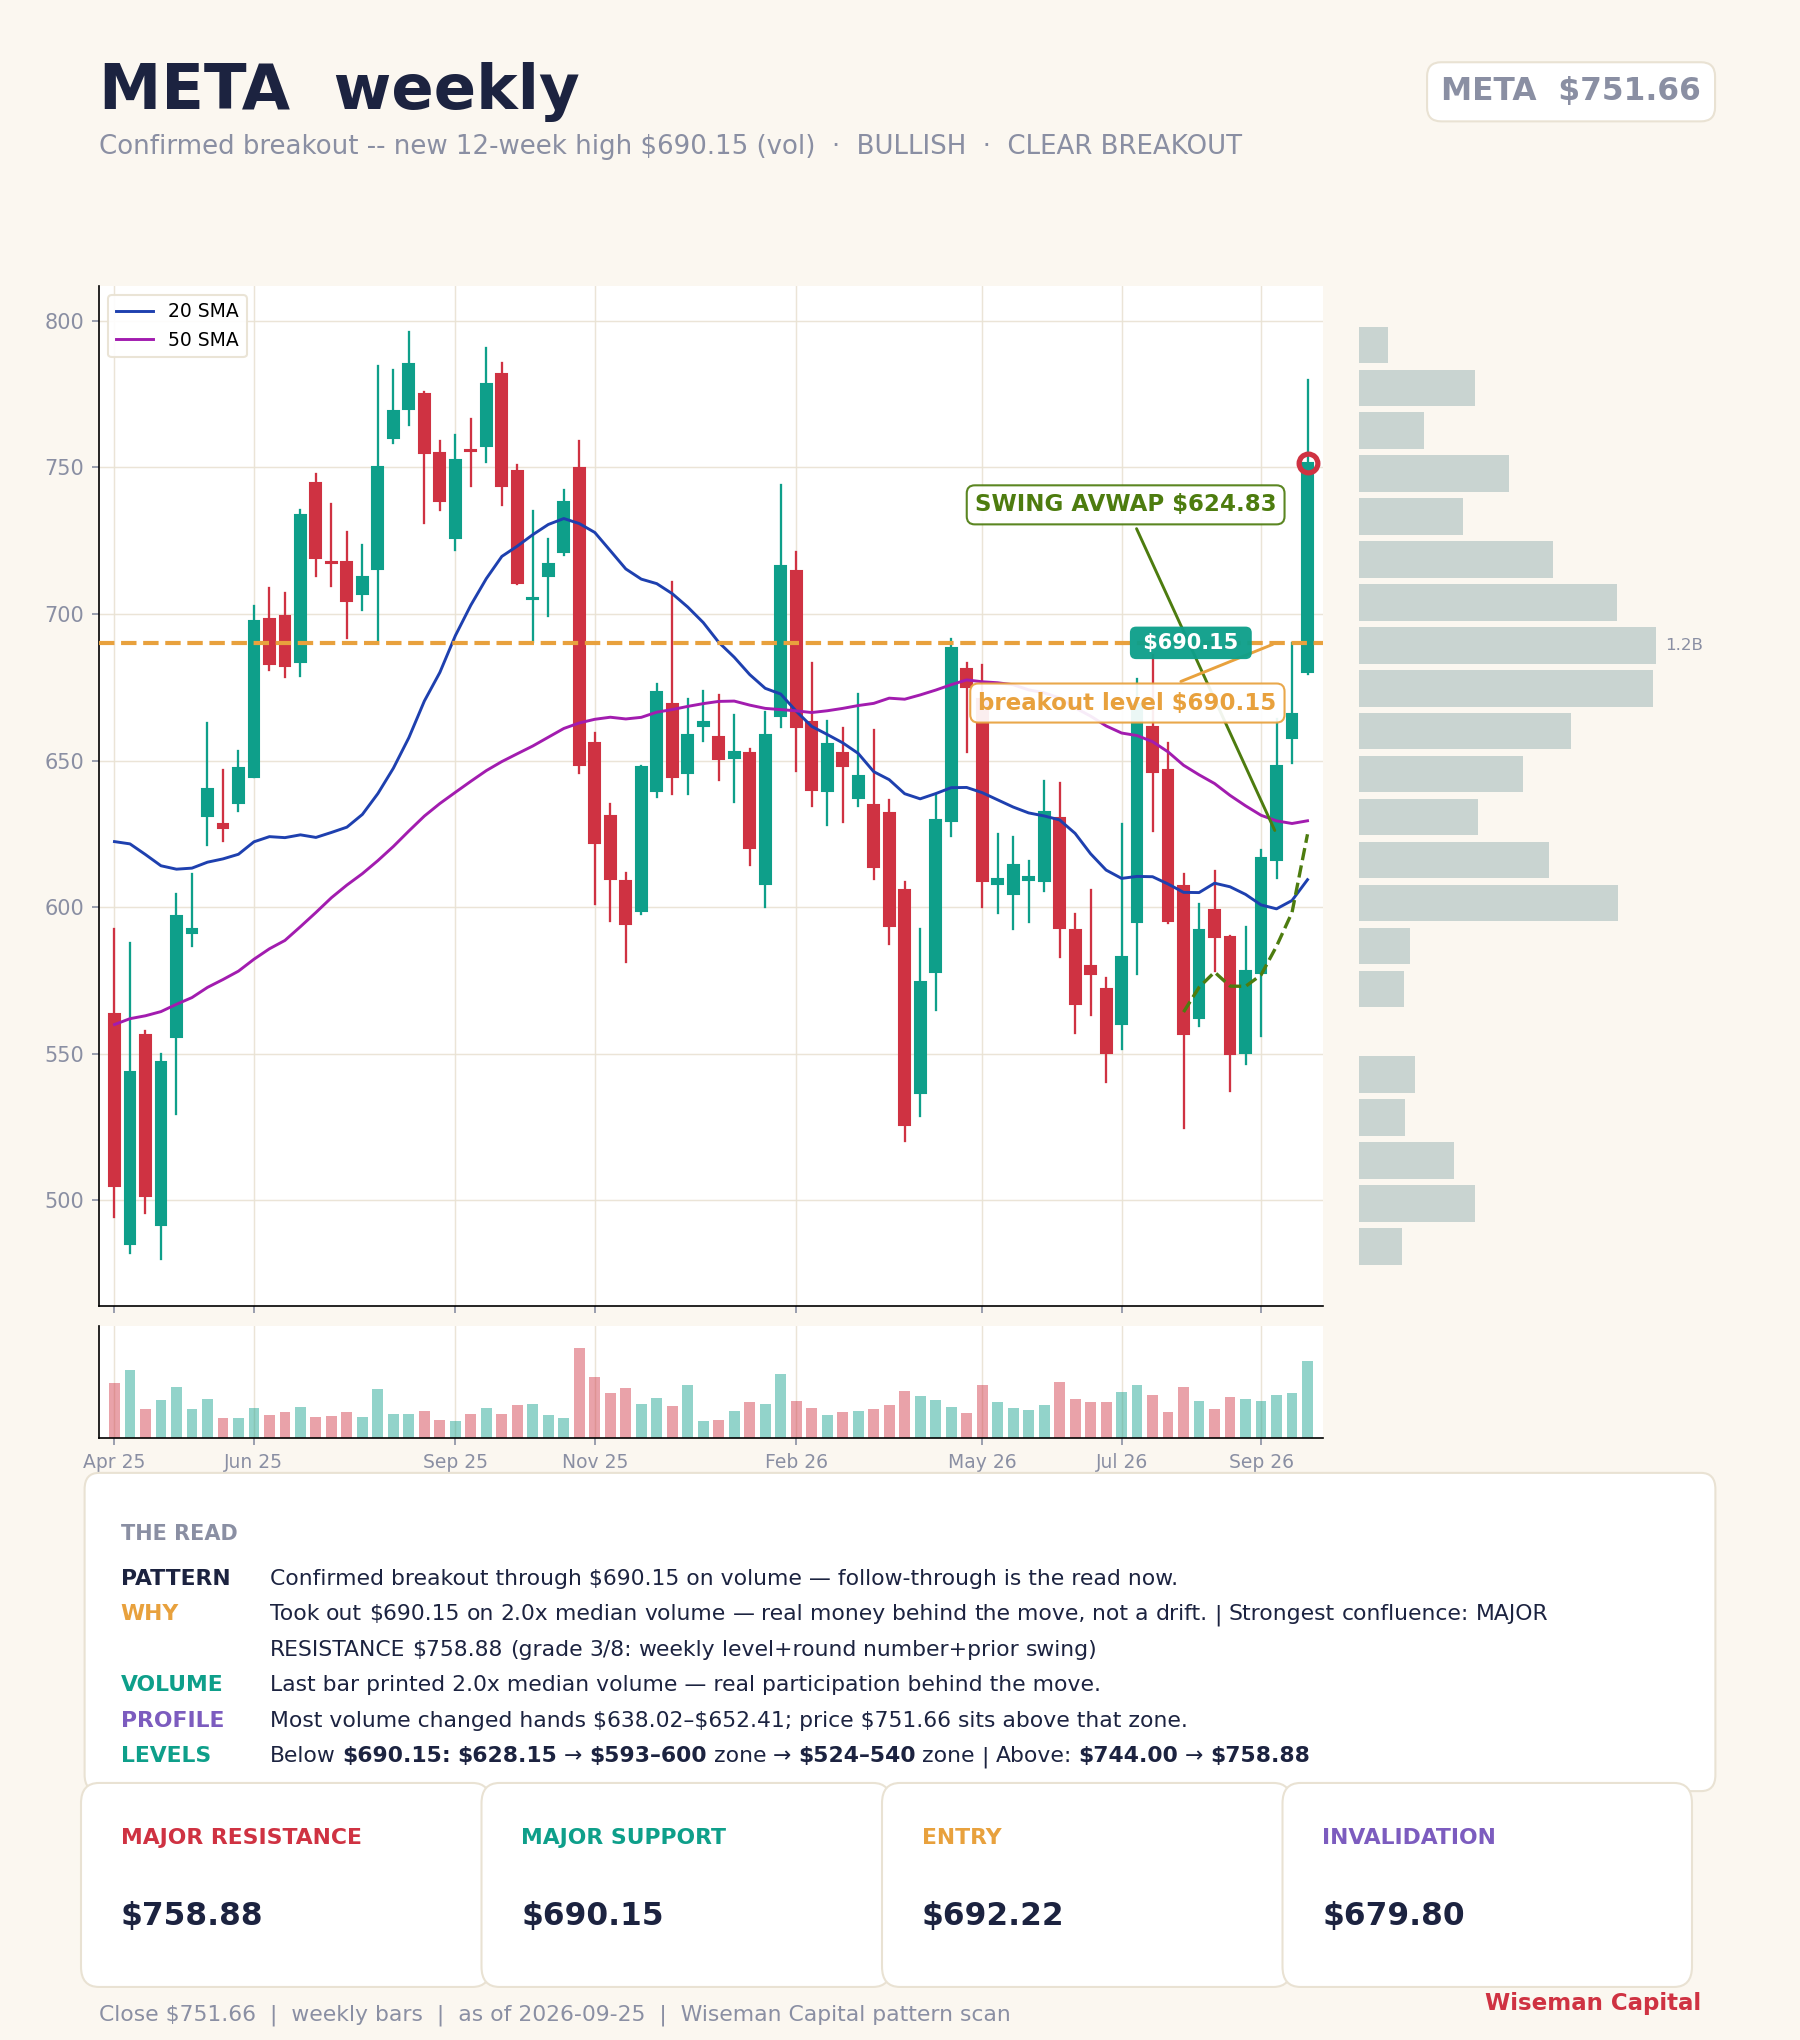
$META — confirmed breakout on volume
The liftoff from the 600s, on one card: months of basing, then a decisive weekly push through $690.15 on twice the usual volume.
Major support $690.15
Major resistance $758.88
Entry $692.22
Invalidation $679.80
The read: took out $690.15 on 2.0x median volume — real money behind the move, not a drift. Most volume changed hands between $638 and $652, and price now sits well above that zone.
Friday, September 25, 2026 · Monthly chart
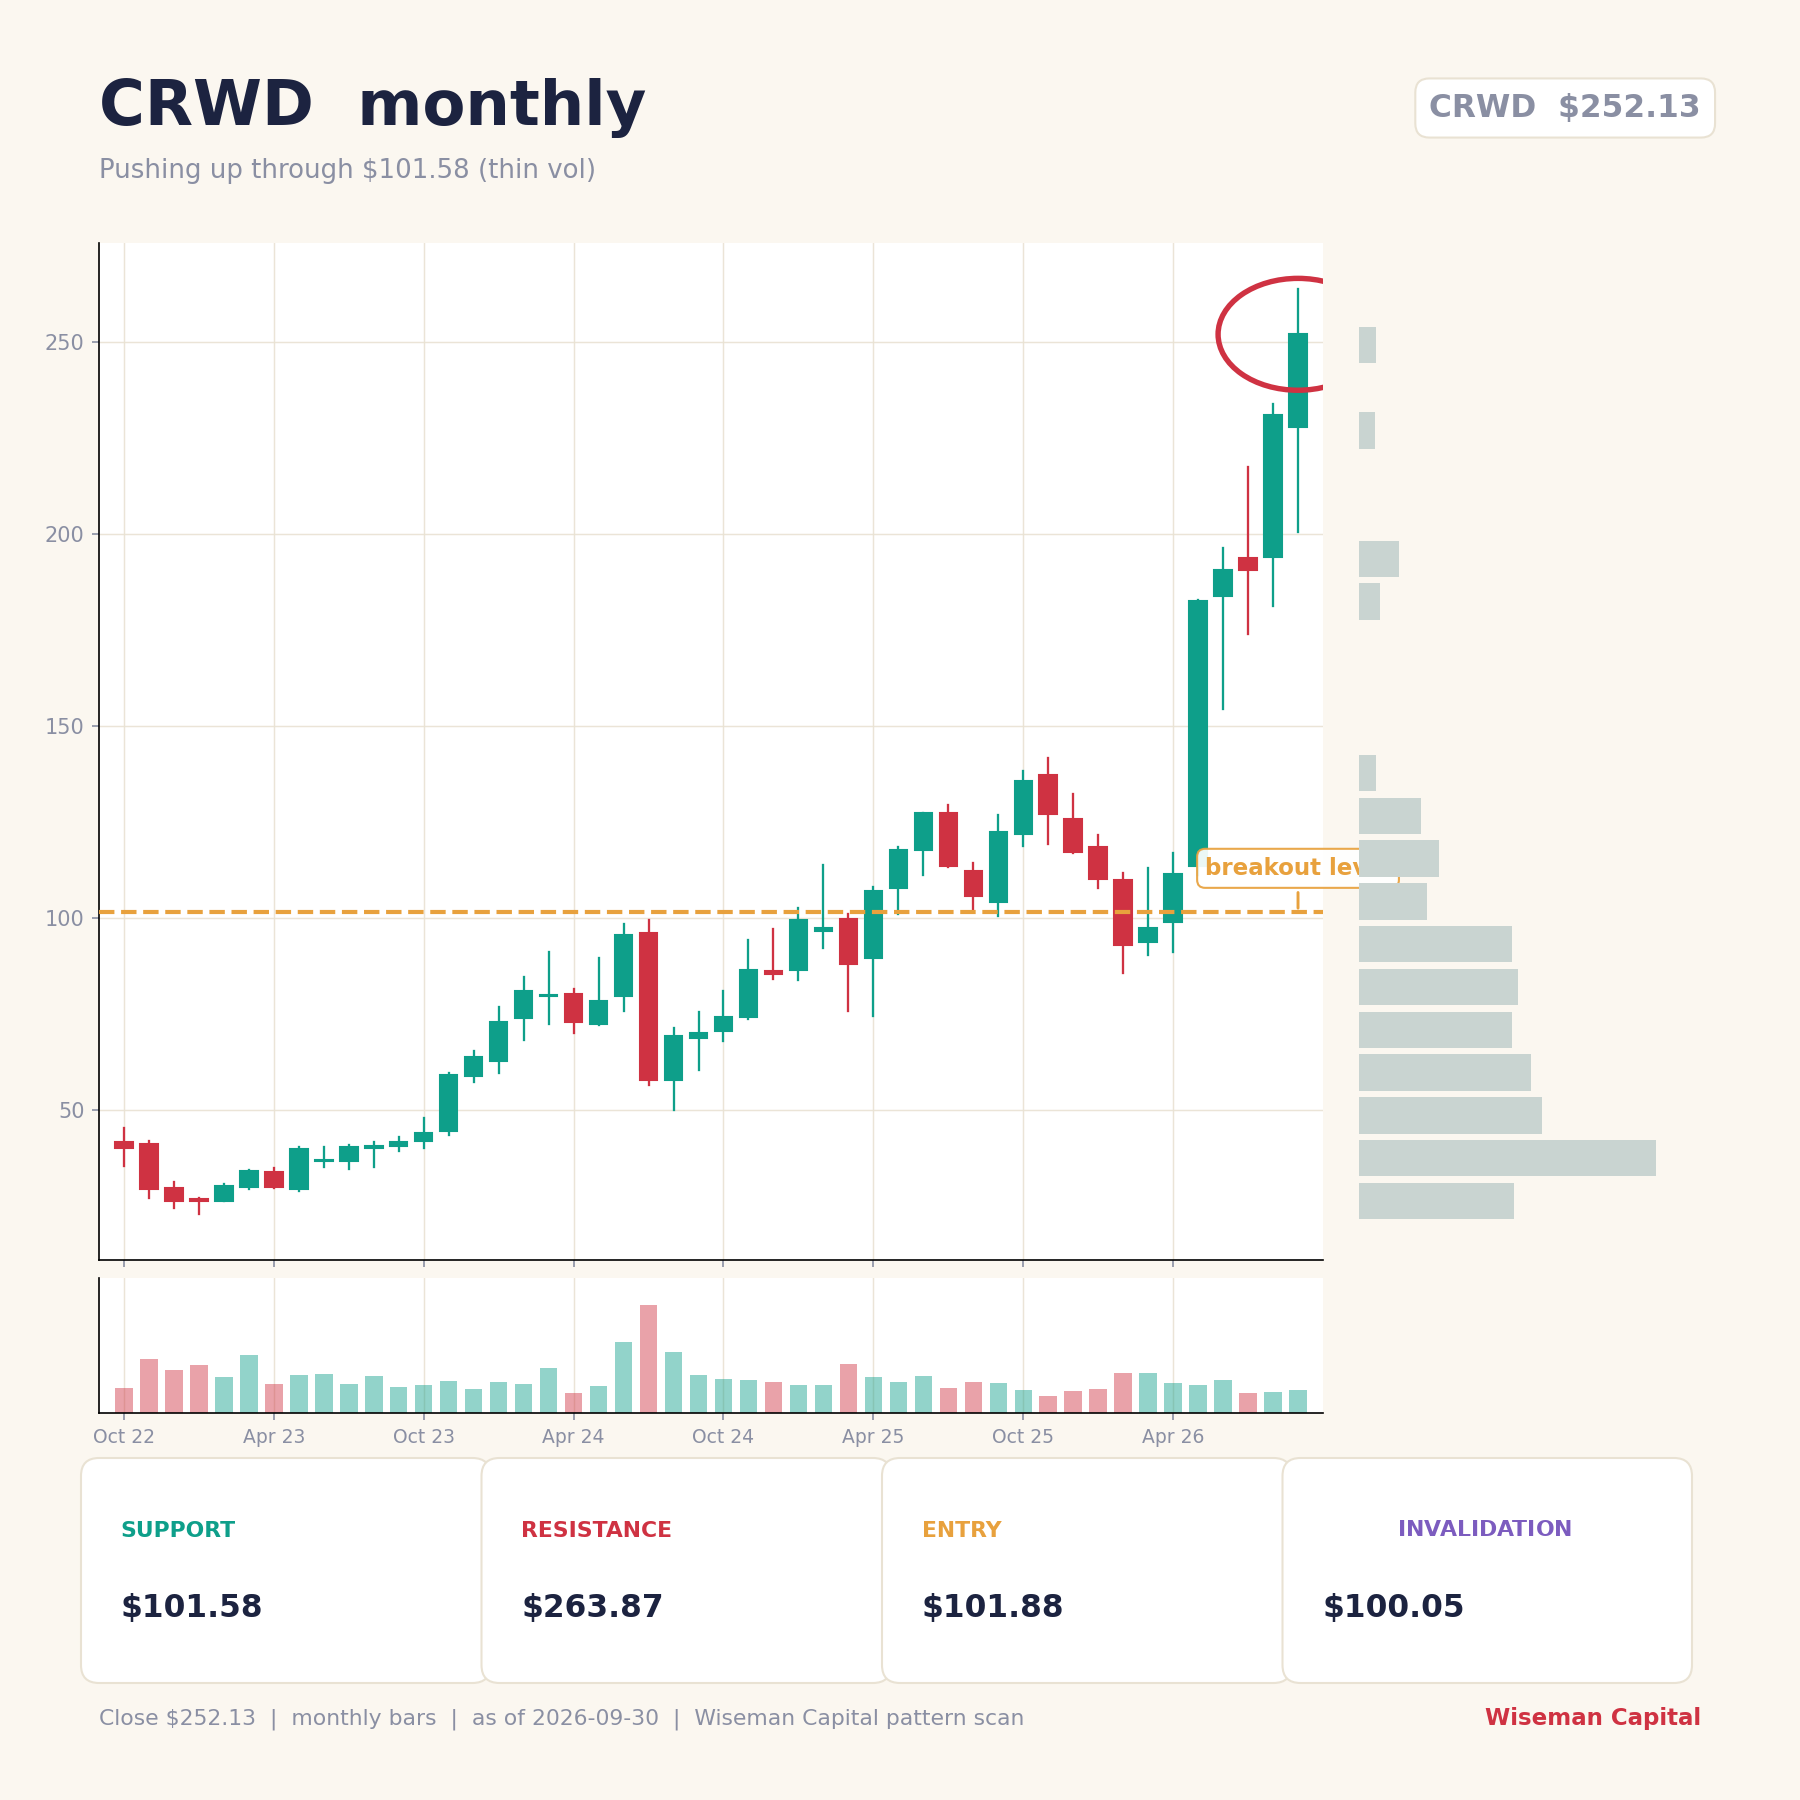
$CRWD — pushing up through $101.58
A textbook base breakout: years of basing under $101.58, then a decisive monthly push through it.
Support $101.58
Resistance $263.87
Entry $101.88
Invalidation $100.05
The read: the breakout level, the entry just above it, and the invalidation just below — the whole trade defined on one card before the move extended.
Examples from Friday, September 25, 2026. They show what the work looks like, not a promise of future results. Investing involves risk; content is educational and not financial advice.